
We often have questions about what a “good” sufficiently developed SAFe Epic looks like. In this example we use with clients during the Lean Portfolio Management learning journey, we dive into an example of real-world details behind an epic hypothesis statement.
For now, we have not provided a fully developed SAFe Lean Business Case as an example because business cases are typically highly contextual to the business or mission. That being said please remember that the core of the business case is established and driven from the Epic Hypothesis Statement and carried over into the documented business case.
NOTES
This Epic is intentionally bloated with more detail than we would really want normally. The intent is to provide depth in examples. Use the example wisely and be sure to lean out your actual epics and keep them focused.
Agile Lifecycle Management Solution Enabler Epic
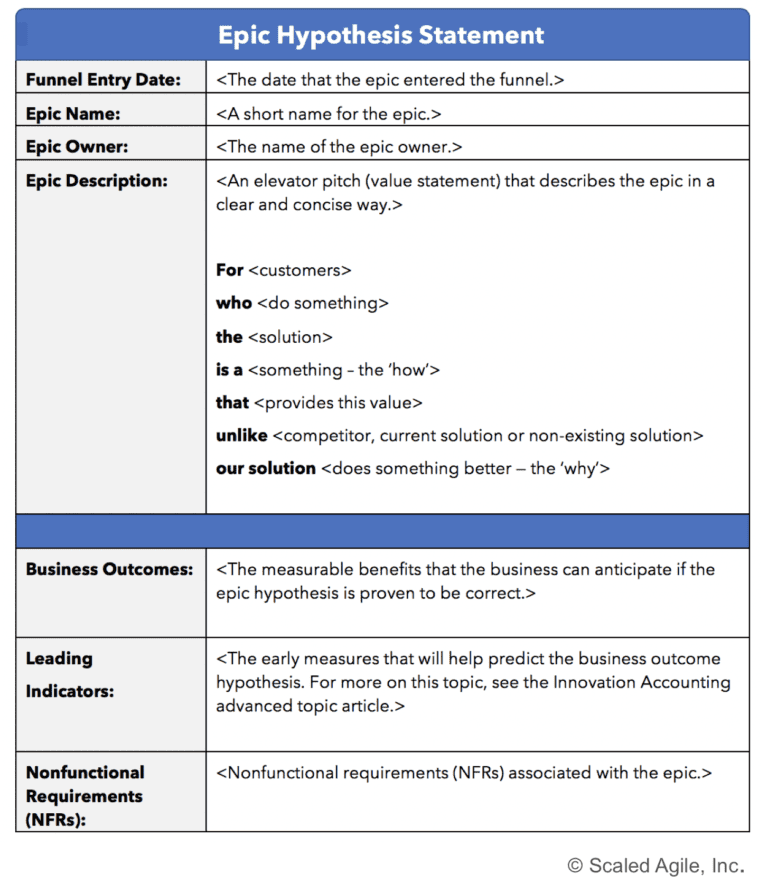
Epic Owner: John Q. Smith
Epic Description
The big awesome product company requires a common platform for collaboration on work of all types across the portfolio for all teams, managers, architects, directors, and executives including customer collaboration and feedback loops. This solution will solve the problems in our system where we have poor quality or non-existent measurement and multiple disparate systems to manage and report on work.
For the Portfolio Teams
Who needs to manage their work, flow, and feedback
The single-source system of record for all work
IS A web-based software tool suite that provides customizable workflows that support the enterprise strategic themes related to creating better business and IT outcomes using guidance from the Scaled Agile Framework for Lean Enterprises (SAFe), Technology Business Management (TBM), and Value Stream Management (VSM) via the Flow Framework
THAT will provide a common place for all customers and portfolio stakeholders to have a transparent vision into all of the work occurring in the system/portfolio, provide a mechanism to manage capacity at scale, and enable easier concurrent road mapping
UNLIKE the current array of disparate, ad hoc tools and platforms
OUR SOLUTION will organize all work in a holistic, transparent, visible manner using a common enterprise backlog model combined with an additive enterprise agile scaling framework as guidance including DevOps, Lean+Systems Thinking, and Agile
Business Outcomes:
- Creating a system with Lean attributes and flow: Cycle times and lead times for team flow, features, products, and solutions become readily available for consumption to drive relentless improvements. (binary)
- Validate that the solution provides easy access to data and/or analytics, and charts for the six flow metrics: distribution, time, velocity, load, efficiency, and predictability for product/solution features (our work). (binary)
- The solution also provides flow metrics for Lean-Agile Teams stories and backlog items. (binary)
- 90% of teams are using the solution to manage 100% of their work and effort within the first year post implementation
- Creating an environment where knowing where the constraint in the system is located will directly enable teams to improve and create better business outcomes. Bottlenecks can be eliminated, mitigated, or moved to economically feasible locations. (binary)
- All features and their lead, cycle, and process times (for the continuous delivery pipeline) are transparent. Feature lead and cycle times for all value streams using the system are visible. (binary)
- Lean flow measurements — Lead and cycle times, six SAFe flow metrics, and DevOps metrics enabled in the continuous delivery pipeline integrated across the entire solution platform (binary)
- Activity ratios for workflow, processes, and steps are automatically calculated (binary)
- Percent complete and accurate (%C&A) measures for value streams automatically calculated or easily accessible data (binary)
- Number of documented improvements implemented in the system by teams using data/information sourced from the ALM solution > 25 in the first six months post implementation
- Number of documented improvements implemented in the system by teams using data/information sourced from the ALM solution > 100 in the first year post implementation
- Flow time metrics improve from baseline by 10% in the first year post implementation (lead time for features)
- Automated/semi-automated generation of roadmaps from the backlog (at scale using the SAFe Enterprise Backlog Model) and flow using real-time data. The roadmap feature of the solution will provide customers and the organization with telemetry to guide future decision-making and agile product delivery. Ultimately, enabling better business outcomes through more accurate and transparent roadmaps and communication on investment decisions.
Internal and external Customers will have direct and accurate forecast insight into when their preferred products and services will be delivered that are driven by actual business context (epic, solution/capability, and feature roadmaps). We desire to eliminate assumption-based queues and disconnected silo-driven plans that often fail to mitigate dependencies and risks. The capability to create multiple versions of roadmaps views for internal and external customers will enable greater communication (dependent)- Portfolio, Solution/Capability, and Program Roadmaps can be generated by Lean Portfolio Management (LPM), Solution Management, and Product Management at will from real-time data in the ALM (binary)
- Roadmaps will be available online for general stakeholder consumption (transparency)
- Increase customer NPS for forecasting and communication of solution progress and transparency of execution by 20% in the first year post implementation (survey + baseline)
- A single source system of record makes all work and flow completely transparent, reduces tool noise, and therefore drives efficiencies in production rates for the system. Allows the business to meaningfully apply systemic capacity management and planning capability.
- Build a taxonomy for all work including a service catalog (binary)
- Run the system and the system produces the data to produce the capacity metrics for all value streams to enable the LPM guardrail (binary)
- Stops obfuscation of work hidden in the noise of the one sized fits all backlog model (everything is a CRQ/Ticket) and allows for more accurate and representative prioritization including the application of an economic decision-making framework using a taxonomy for work (binary)
- Enables full truth in reporting and transparency of actual flow to everyone, real-time – including customers (100% of work is recorded in the system of record)
- Enables live telemetry of progress towards objectives sourced through all backlogs, roadmaps, and flow data and information (dependent)
- 90% of teams are using the solution to manage 100% of their capacity within the first year post implementation
Leading Indicators:
- Increased daily utilization of the ALM solution by team members for day-to-day activities and programmatic, portfolio activities
- Total value stream team member utilization > 95% daily vs. weekly vs. per PI
- Low daily utilization < 75% indicates there is a problem with the solution, training, or something else to explore
- % of teams using the ALM solution to manage 100% of their work and effort
- Usage metrics of [old solutions] for tracking work drop significantly as teams are on-boarded to the new ALM (in accordance with the plan)
- Number of changes in the [old solutions] data from the implementation start date
- Usage metrics for the [old solutions]
- Insight and visualization of WIP
- The Portfolio, Program(s), and Team(s) are managing and limiting WIP within the tool using cycles and/or sprints/iterations as time concepts
- We can see kanban systems and working agreements for workflow state entry and exit criteria in use in the system records
- Team Capacity and velocity are visible in the solution in relation to the completion of goals and objectives.
- Teams have a velocity metric that they use solely for the use of planning an iterations available capacity and not for measuring team performance (only useful for planning efficiency performance)
- Teams use velocity and flow metrics to make improvements to their system and flow (# of improvements acted from solution usage)
- Teams are able to measure the flow of items per cycle (sprint/iteration) and per effort/value (story points; additive)
- Program(s)[ARTs] are able to measure the flow of features per cycle (PI) and per effort/value (story points; additive from child elements)
- Portfolio(s) are able to measure the flow of epics per cycle (PI) and per effort/value (story points; additive from child elements)
- The Portfolio, Program(s), and Team(s) are managing and limiting WIP within the tool using cycles and/or sprints/iterations as time concepts
- Teams have
- Established Flow, by displaying discipline in making work visible and managing and limiting WIP in the solution
- % of total work activity and effort in the portfolio visible in the solution
- Measured Flow, the teams are making documented improvements to the system and solutions they build using data obtained from actual flow
- Show the six flow metrics
- Established Flow, by displaying discipline in making work visible and managing and limiting WIP in the solution
- [Product] Roadmaps for the program(s) and the starting portfolio are developed and maintained for features and epics
- Features (Program) – current PI and two PI’s into the future
- Epics and Capabilities – current PI up to two+ years into the future
- Feature/story planning efficiency…
- are the things we said we were going to work on and what we actually worked on in relation to objectives and priorities (not just raw outputs of flow) the same?
- Applied capacity management strategy for the portfolio
- The portfolio has a reasonable and rationalized, quality understanding of how much capacity exists across current and future cycles (PI) in alignment with the roadmap
- Identification and reporting of capacity across Portfolio is accurate and predictable;
- Identification of Operational/Maintenance-to-Enhancement work ratio and work activity ratios and % complete and accurate (%C&A) data readily available in the system
- Data in the ALM system represents all work occurring in the system (not apportioned, special, or even if still a project),
- including operations and maintenance (O&M) work and enhancements,
- highlighting categories/types of work
- Work activity ratios are in alignment with process strategy and forecasts, process intent, and incentivizing business outcomes;
- allows leadership to address systemic issues;
- data is not just reported, but means something and is acted upon through decision-making and/or improvements
- Number of fully vetted and formed Epics, full representation of viable MVPs in the backlog/system
- # of epics created over time
- # of epics accepted over time
- # of MVP’s tested and successful
- Parameters configured in the tool to highlight and constrain anti-patterns
- Stimulates feedback loop to assist in making decisions on whether to refine/improve/refactor and in that case, what to refine/improve/refactor
- Strategic themes, objectives, key results, and the work in the portfolio – Epics, Capabilities, Features, Stories traceability conveyed from Enterprise to ART/Team level
Non-Functional Requirements
- On-Premise components of the ALM solution shall support 2-Factor Authentication
- SaaS components of the ALM solution shall support 2-Factor Authentication and SAML 2.0
- The system must be 508 compliant
- The system must be scalable to support up to 2000 users simultaneously with no performance degradation or reliability issues
- Must be the single-source system for all work performed in the portfolio and value streams.
- ALM is the single-source system of record for viewing and reporting roadmap status/progress toward objectives
Building your Experiment – The Minimum Viable Product (MVP)
Once you have constructed a quality hypothesis statement the product management team should begin work on building the lean business case and MVP concept. How are you going to test the hypothesis? How can we test the hypothesis adequately while also economically wrt to time, cost, and quality? What are the key features that will demonstrably support the hypothesis?